
Tutorials
Welcome to Market Data’s Quickstart Tutorials! Here, you’ll find comprehensive guides and tutorials to help you get started with our two powerful products: the Market Data API and the Google Sheets Add-On. Whether you’re a developer looking to integrate real-time and historical market data into your applications using our API or a trader who prefers the simplicity and flexibility of Google Sheets, we have the resources you need.

Candles vs Quotes, What’s The Difference?
Candles or quotes? STOCKDATA returns both, and picking the wrong one skews your spreadsheet. Here is what each one holds and when to use it.

How To Get An Option Chain In Google Sheets
Use the OPTIONCHAIN formula to get a complete real-time option chain in Google Sheets. Filter by date, days to expiration, strike, deltas, and more.

How to Calculate Theta For An Option
Learn how to calculate theta for an option and add time decay to your Google Sheets spreadsheet with the OPTIONDATA formula and Black-Scholes.

How To Get Historical Options Prices For Your Spreadsheet
Using the Market Data Add-on, it is possible to get historical options prices going back decades directly into your spreadsheet with a simple formula.

How To Use The Historical Stock Data API
Learn by example and get started with the historical stock data api. Both daily and intraday data is available going back decades.

How To Use the Stock Market API — With Examples!
Get real-time and historical market data from the stock market api. Learn quickly with easy to use examples that work right from your browser.
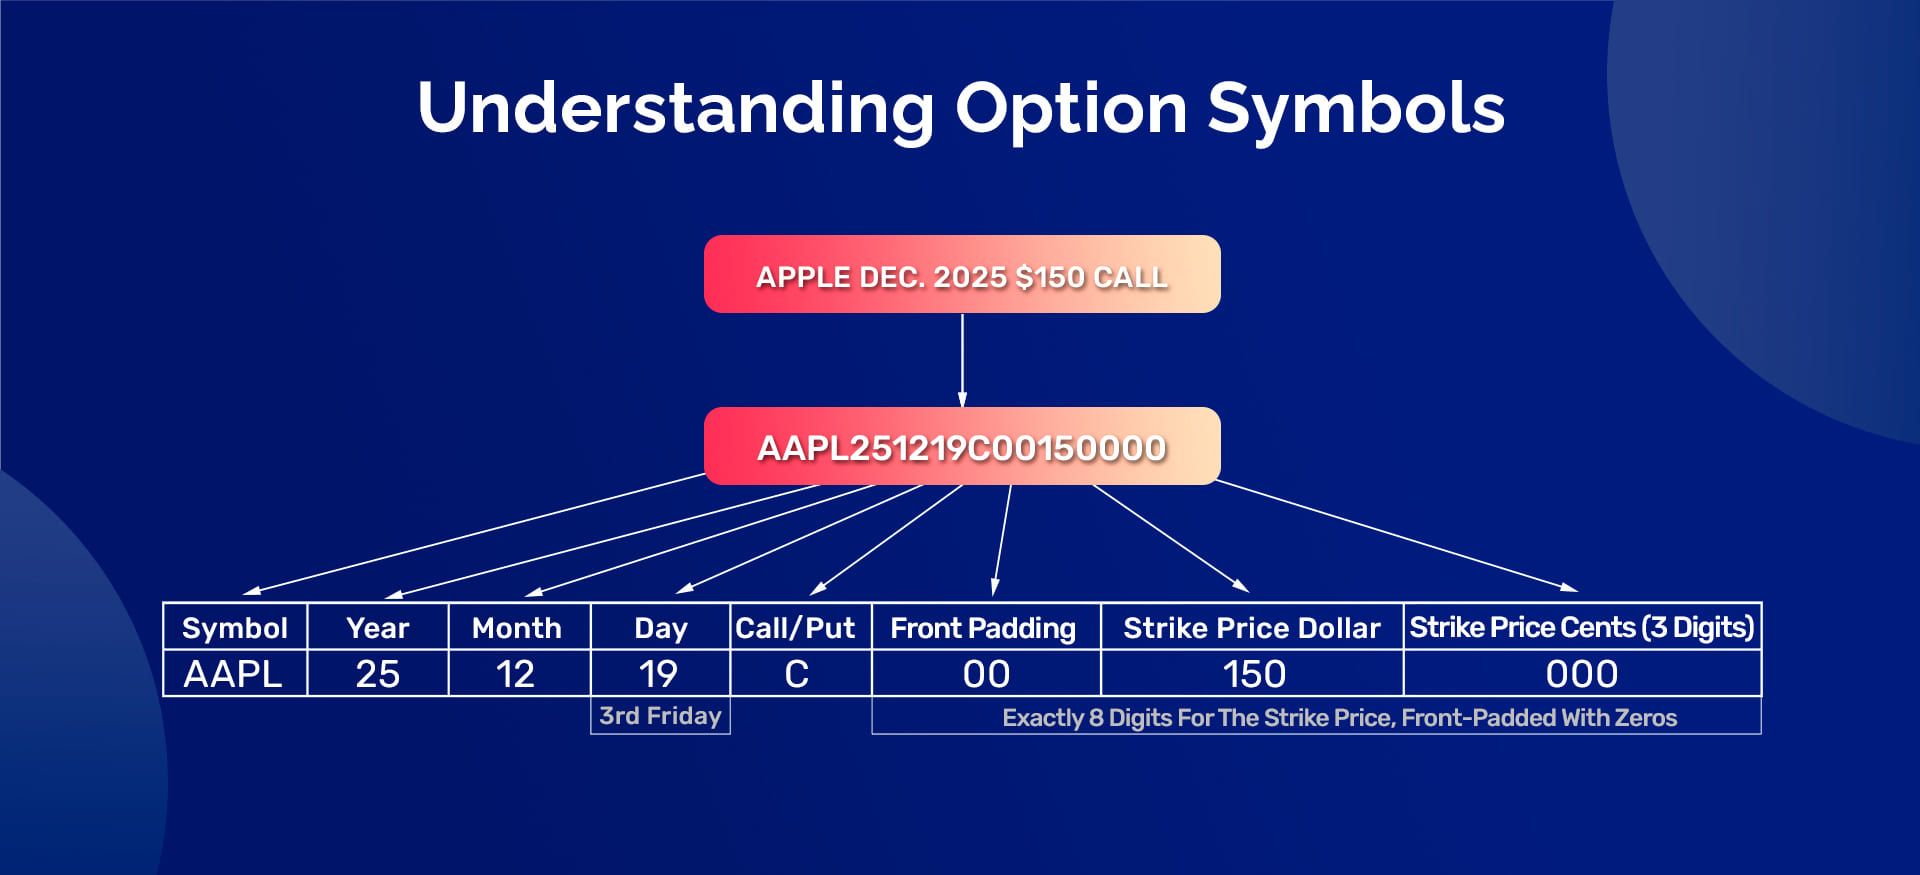
How To Read An Option Symbol — Learn By Example
The best way to understand how to read a U.S. option symbol is with an real life example. Stock Ticker + YYMMDD + C/P + 8 Digit Strike Price.

How To Use The Google Finance API in 2026
The Google Finance API allowed users to query market data and portfolio data until it was shutdown. Learn how to use Google's finance data today.

How To Get Real Time Market Data For US Markets
Get real-time market data for stocks and options via API. Use the spreadsheet add-on to download live market data into Sheets or Excel.

How To Use The Option Data API — With Examples!
The Option Data API allows you to easily get a real-time or historical option quote for stock, ETF, or index options.
How To Calculate The Intrinsic / Extrinsic Value of an Option In Your Spreadsheet
Using the OPTIONDATA formula, you can automatically calculate the implied volatility of any option that is currently trading.

How To Calculate Implied Volatility In Your Spreadsheet
Calculate the implied volatility of any option in Google Sheets with the OPTIONDATA formula, then chart the volatility curve across a whole option chain.