
Options in Google Sheets
Options in Google Sheets is a dedicated resource for traders and investors looking to harness the power of Google Sheets to access, analyze, and manage option data effectively. This category provides in-depth tutorials, practical guides, and tips on how to utilize our Google Sheets add-on to bring real-time and historical options data into your spreadsheets. From basic data retrieval to advanced analysis techniques, it covers everything you need to make informed trading decisions and streamline your options investment strategy using Google Sheets. Whether you’re plotting option chains, calculating potential returns, or tracking market movements, this category empowers you with the tools and knowledge to leverage option data directly within the familiar interface of Google Sheets.
No articles on this page match that filter.

How To Get An Option Chain In Google Sheets
Use the OPTIONCHAIN formula to get a complete real-time option chain in Google Sheets. Filter by date, days to expiration, strike, deltas, and more.

How to Calculate Theta For An Option
Learn how to calculate theta for an option and add time decay to your Google Sheets spreadsheet with the OPTIONDATA formula and Black-Scholes.

How To Get Historical Options Prices For Your Spreadsheet
Using the Market Data Add-on, it is possible to get historical options prices going back decades directly into your spreadsheet with a simple formula.
How To Calculate The Intrinsic / Extrinsic Value of an Option In Your Spreadsheet
Using the OPTIONDATA formula, you can automatically calculate the implied volatility of any option that is currently trading.

How To Calculate Implied Volatility In Your Spreadsheet
Calculate the implied volatility of any option in Google Sheets with the OPTIONDATA formula, then chart the volatility curve across a whole option chain.

How To Calculate Option Greeks In Your Spreadsheet
The OPTIONDATA formula pulls delta, gamma, theta and vega straight into your spreadsheet, so position risk updates itself with the market.
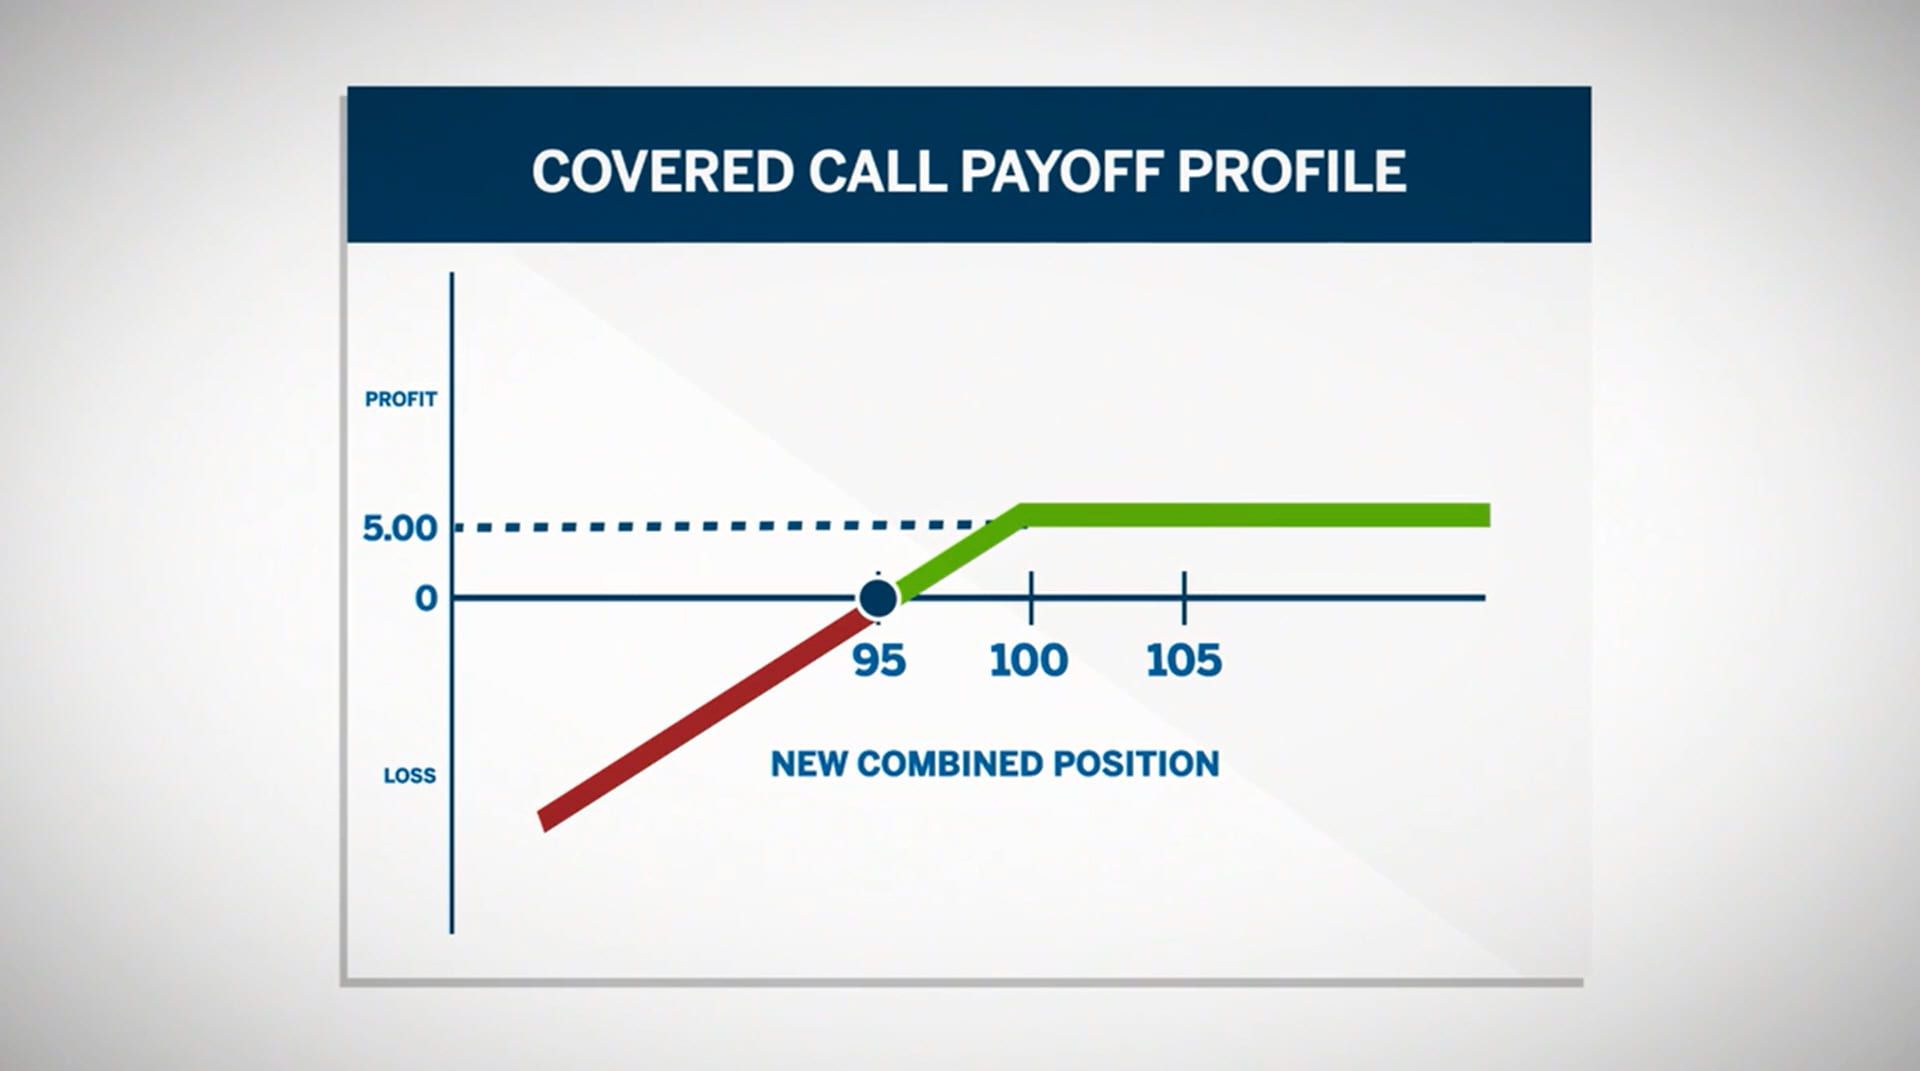
How To Build A Covered Call Spreadsheet
Build a covered call tracker in Google Sheets, formula by formula — and download our free example sheet to start tracking your positions today.
How To Get Options Prices in Google Sheets
Learn how to add real-time and historical options prices into your Google Sheets spreadsheets using a single formula.